
Klaus Schwab
Stakeholder Capitalism
Rising Debt
Consider first rising debt. Global debt—including public, corporate, and household debt—by mid-2020 stood at some $258 trillion globally, according to the Institute of International Finance,44 or more than three times global GDP. That number is hard to grasp, because it is so big and because it includes all sorts of debt, going from public debt sold through government bonds to mortgages from private consumers.
But it has been rising fast in recent years, and that certainly is “alarming,” as Geoffrey Okamoto of the IMF said in October 2020. Not since World War II were debt levels in advanced economies so high, the Wall Street Journal calculated,45 and unlike in the post-war period, these countries “no longer benefit from rapid economic growth” as a means to decrease their burden in the future.
The COVID pandemic, of course, brought an exceptional acceleration of the debt load in countries around the world, and especially for governments. According to the IMF, by mid-2021, in the span of a mere 18 months, “median debt is expected to be up by 17 percent in advanced economies, 12 percent in emerging economies, and 8 percent in low-income countries”46 compared to pre-pandemic levels.
But even without the pandemic, debt had been creeping up in the past three decades. As one example: in advanced economies, public debt rose from about 55 percent in 1991, to over 70 percent in 2001, and more than 100 percent in 2011. It is estimated to reach more than 120 percent in 2021.47
Faced with slowing global growth over the past decades, especially in advanced economies, governments, companies, and households nevertheless increased their debt. Could that have ever been a good idea? Theoretically, yes. When used to invest in productive assets, debt can be a lever of future economic growth and prosperity. But all debt does of course need to be repaid at some point (unless it evaporates because of inflation, but that has been less than 2 percent on average in advanced economies in the past 20 years48). The only alternative is to default, but that is akin to playing Russian roulette.
So what kind of debt has been made in recent decades? The debt of governments is often a mix of high-quality and low-quality debt. High-quality debt includes that used for building modern infrastructure or investments in education, for example. High-quality debt is typically paid back over time—and can likely even provide a return on the investment. Such projects should be encouraged. By contrast, low-quality debt, such as deficit spending to boost consumption, generates no returns, even over time. This type of debt should be avoided.
Overall, it is safe to say low-quality debt is on the rise. In part, this is because low interest rates in the West incentivize lending, which discourages borrowers from being careful with their spending. For governments, deficit spending has become the norm in recent decades, rather than the exception. The COVID crisis that erupted in the early months of 2020 hasn't made that picture any rosier. Many governments have effectively used “helicopter money” to sustain the economy: they printed money, creating an even higher debt with their central banks, and handed it to citizens and businesses in the form of one-off subsidies and consumption checks so they could get through the crisis unscathed. In the short term, this approach was necessary to prevent an even worse economic collapse. But in the long run, this debt too will need to be repaid. Overall, it adds to the large amounts of debt in recent years that wasn't used to spur long-term economic growth or to make the switch toward a more sustainable economic system. This debt will thus remain a millstone, hanging around many governments’ necks.
One silver lining comes from emerging and developing markets. Before the COVID crisis, they had relatively lower public debt levels of around 50–55 percent,49 with much of it invested in infrastructure (though during the COVID crisis, the debt level increased by about 10 percent). Some of these countries can be considered to have a demographic dividend, meaning a population with an average age in the low twenties, that is, heavily skewed toward younger generations. This type of population pyramid could make repaying debt more feasible if the coming surge in their working-age population is complemented by an equally high surge in available jobs. (The latter, however, has proven problematic in some Arab and African economies. Faced with a job shortage, a demographic dividend can rather turn into a ticking time bomb.50, 51)
How some ageing Western countries are supposed to repay their debts in a slowing economy, though, is highly questionable. The economies with the highest government debt load have historically been Japan and Italy. In addition to their debt, they have some of the world's most rapidly shrinking and ageing populations. While private savings of Japanese households can alleviate many of the most acute problems this trend could cause, the country's debt will sooner or later come back to haunt it, as its population shrinks from 127 million to fewer than 100 million over the next three decades, and its ratio of workers to retirees falls even further. It could easily increase the debt burden per head by another quarter or third.52
Other European countries such as France, Spain, Belgium, and Portugal, all of which have gross public debt of over 110 percent of GDP53 (and often much higher than that), could one day find that they are facing a similar fate. In a significant development, the United States joined the 100 percent club in the early 2010s, with its debt rapidly rising further in recent years, to over 130 percent in 2020.54 The US situation raises a peculiar uncertainty because US government bonds are among the most traded in the world, and the US dollar is the de facto world reserve currency. A US government default is unlikely, given that its Federal Reserve has its hands on the printing press, but if it does happen, the global economic system as we know it might collapse.
It is in the combination of high debt and low growth that things really get problematic, from a financial point of view. In an environment where growth of 3 percent and more can be expected, government debt can quickly evaporate: the relative importance of past debt would decline in comparison to a growing GDP. Even in the recent past, countries like Germany and the Netherlands managed to considerably lower their debt burden on the back of favorable economic growth. But if low growth does remain the new normal, which seems likely, there is no easy mechanism for countries to repay their historical debt. Looking away certainly will not solve this problem.
Low-Interest Rates and Low Inflation
There was one life buoy for low growth and debt until now: low interest rates. Having a low interest on your loan, as many homeowners or student borrowers know, is a blessing. It allows you to pay back your debt without having to worry about the debt load getting larger.
Since the financial crisis, central banks have ushered in an era of low lending rates, giving governments, companies, and consumers low interest rates as a form of relief. The goal is to, ultimately, restore higher growth as people consume more, companies invest more, and governments spend more.
In the United States, the Federal Reserve kept interest rates near zero from 2009 until 2016. It then gradually raised them again to 2.5 percent, half the historical normal rate. But in 2019, the Fed once again cut interest rates55 several times, and when COVID hit, it crashed back down to 0.25 percent.56 Given the challenging macroeconomic environment, a return to the era of high interest rates is very unlikely anytime soon. In other advanced economies, rates are even lower. The European Central Bank has kept its key borrowing rate for the eurozone at under 1 percent since 2012, and at zero since 2016. Most other European countries have similar low rates; Japan and Switzerland even charge depositors for buying bonds, in fact meaning they have a negative interest rate.
As indicated, this is a blessing for governments, companies, and individuals alike who are willing and able to take up new loans or for governments who want to refinance their historical debt. Some observers may even go as far as to suggest the historical debt-to-GDP burden is not as big a problem as it seems, as it can be perpetually refinanced.
But this view fails to consider that repayment problems can quickly get out of hand as government funding gaps for other liabilities increase. Costs related to pensions, health care, and infrastructure are becoming an ever-growing burden on governments, not to speak of consumption subsidies, such as governments paying a part of oil and gas prices for consumers.57 They produce low-quality debt and are hard to roll back, given their popularity with voters.
Public health care spending, notably, already rose by 66 percent from 2000 to 2016—long before the COVID-19 crisis hit—according to the World Health Organization.58 During the same period, GDP growth in OECD countries was only 19 percent. In aggregate, public health care spending in OECD countries now represents close to 7 percent of GDP, with peaks in the United States and Switzerland at double that rate, and that percentage can be expected to rise further as populations age and more viruses or even non-communicable diseases threaten the population. Unless governments can unload these costs to their citizens, many will increasingly struggle to balance their books.
There are more growing government liabilities. The Global Infrastructure Hub calculated the world faces a $15 trillion infrastructure funding gap from 2016 to 2040.59 But infrastructure represents an investment, on which a return could be earned. The problem posed by pensions and retirement savings is an order of magnitude larger, and returns are much lower: unless policies are changed, the World Economic Forum estimates60 the pension savings gap will balloon to $400 trillion in the eight countries with the world's largest pension systems by 2050, with unsecured public pension promises making up the lion's share of that shortfall.
On top of this debt burden is low inflation. Historically, interest rates and inflation tended to be inversely correlated, and central banks used their power to set interest rates as a tool to either curb inflation or stimulate it. By setting high interest rates, central banks gave people, companies, and governments an incentive to save money rather than spend it, easing upward pressure on prices. By setting low interest rates, they gave people the reverse incentive, namely to spend money and push up prices, since saving it wouldn't yield interest anyway.
Since about a decade, however, this inverse correlation has all but ceased to exist in the West, with the situation particularly dire in Europe and Japan. Despite years of near-zero interest rates, inflation often remained close to zero as well. While this is no problem in the short run, it does take away a long-term lever to ease the debt load. With rising prices, nominal debt tends to become relatively less of a burden. With flat prices, however, historical debt remains as heavy as a burden tomorrow as today.
But the nexus between low growth, low interests, low inflation, and increasing debt has one more ingredient, and it could be the most lethal of them all: slowing productivity growth.
Declining Productivity Growth
Compounding many of the structural issues outlined in this chapter is the fact that productivity gains have been low in recent years. Indeed, it was because of rising productivity, more so perhaps than demographic growth, that the middle class in the West saw their incomes rise quickly during the first decades after the war.
Productivity goes up most often because of innovations in the way things are made or done. Well-known examples of productivity gains are the assembly line Ford introduced in the early 1900s, the introduction of digital computers instead of typewriters in the 1970s and 1980s, or the optimizing of a taxi route thanks to apps such as Waze today. All these innovations enable a given worker to produce the same output, or do the same job, in considerably less time. That in turn allowed companies to increase wages.
In the past, the world knew periods of high productivity gains, which translated into high wage growth. During America's golden age of capitalism in the 1950s and 1960s, for example, the annual productivity growth was almost 3 percent per year.61 But productivity gains afterward fell to lower levels, and, problematically, even when productivity did rebound, less of it was translated into take-home pay for American workers. Instead, it remained with the businessowners and executives, a phenomenon known as the “decoupling” of wages from productivity.62
Since the 2007–2009 financial crisis, US productivity growth has fallen to the meager level of 1.3 percent per year. That is a problem, because it means it is not possible to grow the pie for everyone anymore. The distribution of today's economic gains is a quasi-zero-sum game. Other countries, such as Germany, Denmark, and Japan, have kept up productivity gains better and translated them also in higher wages. But the trendline is unmistakable: productivity gains in the West are experiencing a marked decline.
Taken together, the indicators presented in this chapter—growth, interest rates, debt, and productivity—point to a systemic design error in the Western economic development model. Much of its prosperity model was based on perpetual economic growth and productivity gains. Now, that growth is grinding to a halt, and problems that had been festering under the surface are becoming more acute by the day.
Kuznets’ curse is coming back to haunt us. GDP was never a perfect measure for well-being. And now that it is becoming an ever-greater challenge to grow it, we will have to deal with a whole basket of other problems we created while pursuing that higher growth.
The Second Kuznets’ Curse: Inequality
While the original Kuznets’ curse of our recent past is the result of the blind pursuit of GDP growth, there is a second Kuznets’ curse. This one relates more directly to the phenomenon Kuznets became known for in his lifetime: the so-called Kuznets curve.
As Kuznets continued his work as an economist in the 1950s, he started to theorize on an interesting phenomenon. He noticed that US income inequality had started to decline in the post-war period, as the economic boom intensified. That contrasted to the pre-war period, in which America had become a major economic power, but income and wealth were concentrated in the hands of a few. A similar observation, though less extreme, could be made for many other developed countries.
Kuznets theorized about the numbers he found, in a paper for and presidential address to the American Economic Association.63 He derived a potential game-changing insight for development economics, provided the findings held true over time. Indeed, it implied a sort of economic law. Inequality worsens as a nation begins to develop, but as development continues, inequality subsides. In other words, the price of inequality societies pay for development early on is offset by higher development and lower inequality later.
The theory put forth by Kuznets became a worldwide sensation, especially after Kuznets won the 1971 Nobel Prize for Economics, awarded for his contributions to national income accounting (rather than the theory of the Kuznets curve). Throughout the 1980s, economists built on Kuznets’ optimistic theory, plotted graphs that showed how it applied to various countries and periods, and prescribed economic development models because of it.
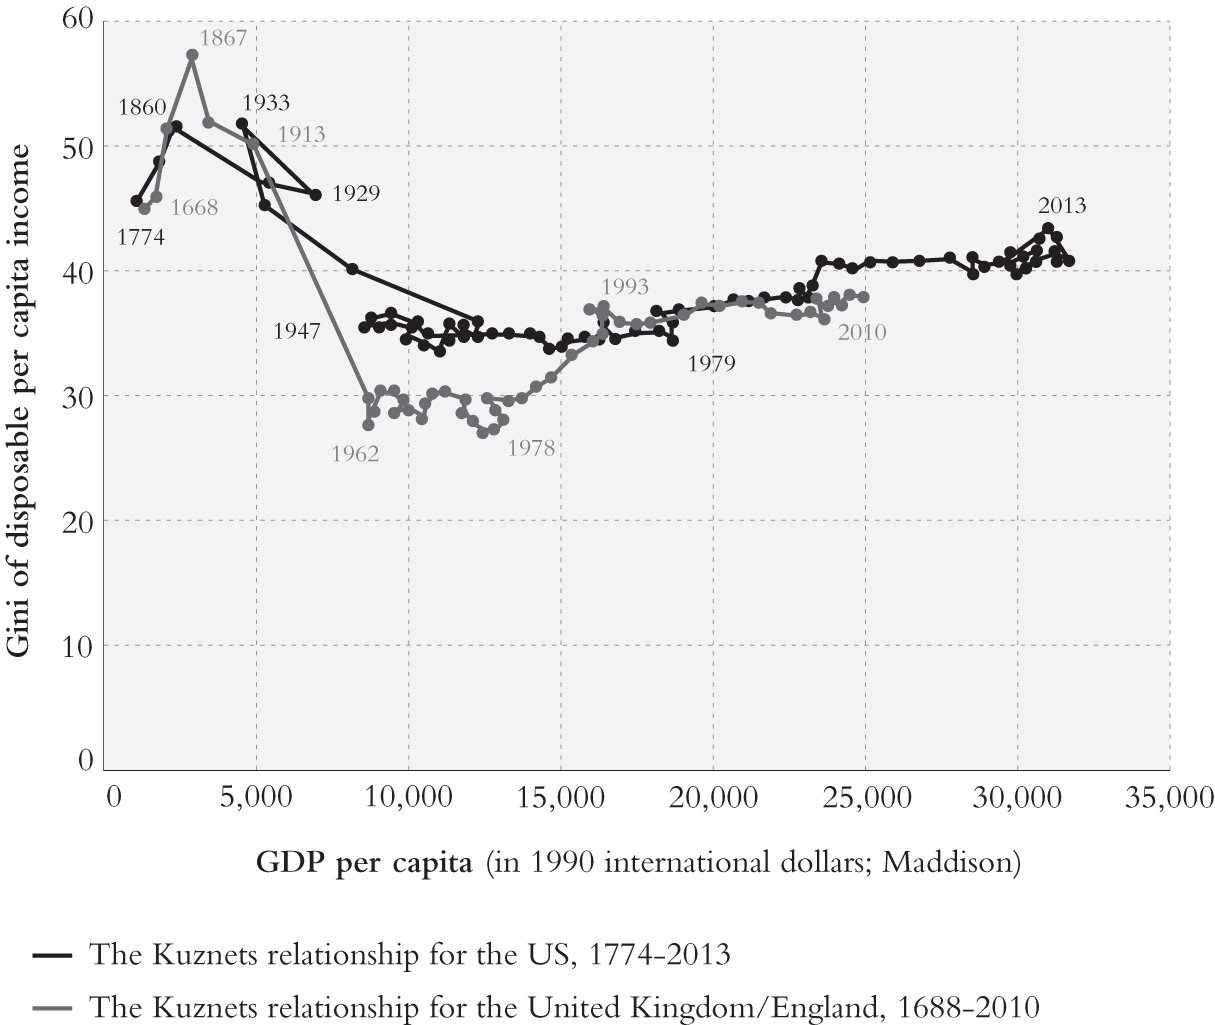
Figure 2.2 Kuznets waves: How income inequality waxes and wanes over the very long run
Source: Redrawn from Lindert, P. H., & Williamson, J. G. (1985). Growth, equality, and history. Explorations in Economic History, 22(4), 341–377..
There was just one problem: over time, the theory no longer held true. Some of the facts we face today reveal this.
Inequality in fact began rising again in highly developed countries. In a 2016 note, economist Branko Milanovic suggested that the current upswing in inequality could be viewed "as a second Kuznets curve", or indeed, as a "Kuznets wave" (Figure 2.2).
Income Inequality
There is a festering wound in our global economic system, and that wound is rising income inequality.
The story starts with an unexpected twist. Global income inequality, measured by plotting incomes of everyone from all over the world, has actually been steadily declining over the last 30 years64 (see Figure 2.3). This may come as a surprise to many readers, given the perception that the opposite is true in many countries. But the global trend is clear: around the world, people earn more equal incomes, not less.
The decline in inequality happened because of one incredibly powerful force: the huge economic leaps forward in incomes in some of the largest (and previously poorest) countries in the world. China, notably, went from being a low-income country to an upper-middle-income65 one since its Reform and Opening-Up. By its own calculation, it lifted some 740 million people out of poverty.66 India, too, knew various periods of rapid growth, and thereby managed to raise the income of many of its people.
The impact of these two countries on global inequality has been all-encompassing: economist Zsolt Darvas of the Bruegel Institute showed that without the changes in China and India, global inequality would have remained exactly where it was, or even gone up quite a bit, depending on the calculation method (see Figure 2.3).
This clarifies the real problem posed by inequality today. Global inequality may have declined, but inequality within nations has drastically worsened.
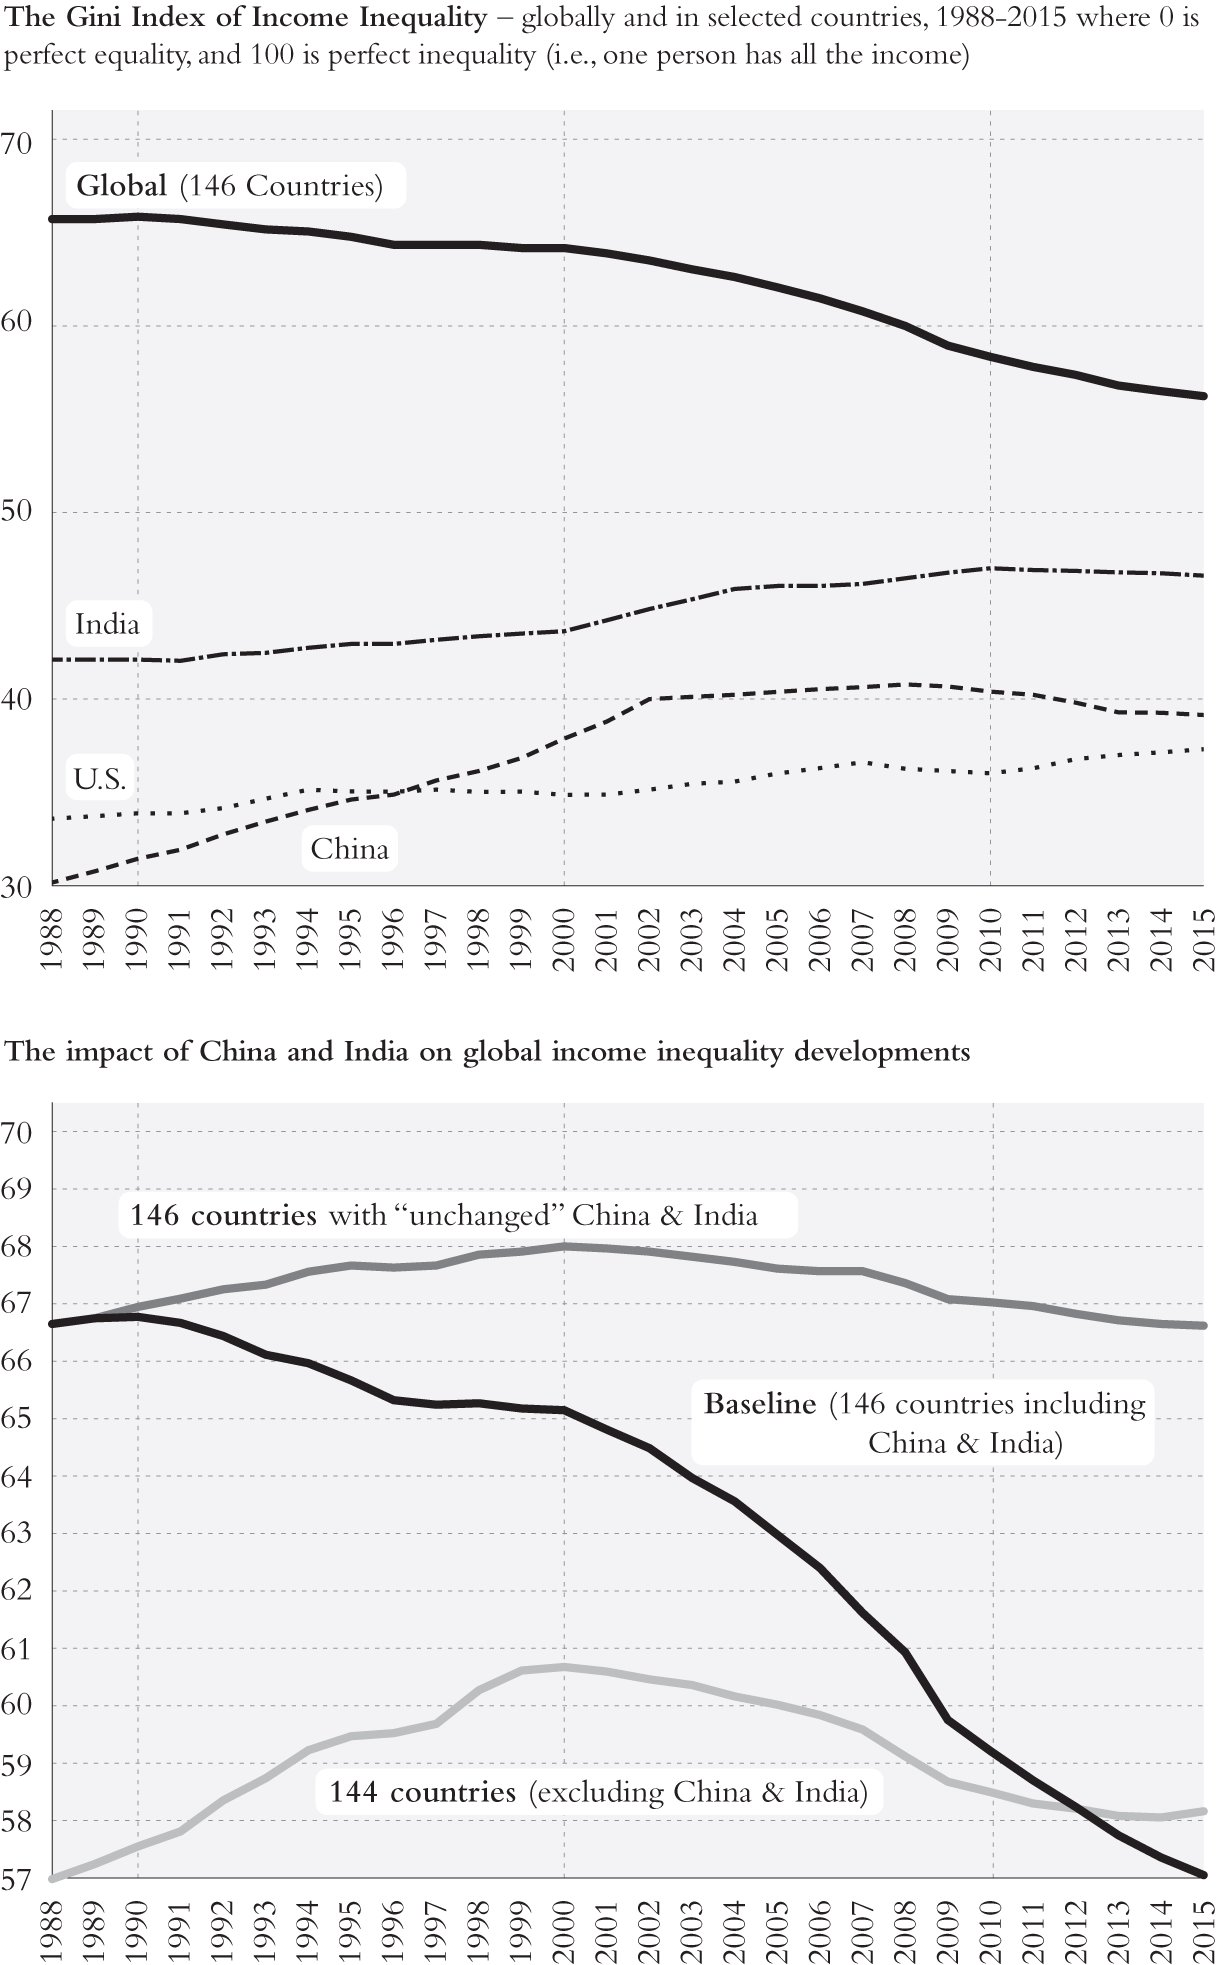
Figure 2.3 The Impact of China and India on Global Income Inequality (Measured in Gini Indices)
Source: Redrawn from Zsolt Darvas, Global income inequality is declining – largely thanks to China and India, April 18, 2018.
In many people's experience, it matters much more how they fare compared to their fellow citizens than to the rest of the world population. In all but a few countries, national inequality has been rising and often rather fast.
The traditional measure of inequality, the Gini coefficient, doesn't do justice to the severity of the problem. The Gini coefficient translates the degree of inequality into a number from 0 (everyone has the same income) to 1 (one person has the entire economy's income). While a higher score over time tells us that inequality has risen, it's difficult to understand what that means in practice. In the US, for example, the Gini coefficient rose from its low point of 0.43 in 1971 to a post-war high of 0.58 today.67 It is an increase, of course, but precisely how good or bad is either number?
Thomas Piketty, a French economist, laid out the problem in a better way. In his 2013 book Capital in the Twenty-First Century,68 he revealed how the share of income that went to the top 10 percent of earners evolved over time. In 1971, his data showed the top 10 percent earners took home one third of national income. In the early 2010s, they took half of income. This leaves the vast majority of workers—the remaining 90 percent—with only half of the national income to divvy up among themselves.
Later numbers from the World Inequality Report, of which Piketty is a co-author, showed how the trend was even more pronounced for the top 1 percent. Over the same period, 1971 to the early 2010s, their income share doubled69 and their incomes more than tripled. This means that in the early 2010s, more than 20 percent of the national income went to the top 1 percent of earners. For those at the bottom of the income pyramid, the situation was much bleaker. Many workers saw their real incomes and purchasing power decline since the early 1980s (Figure 2.4). In the UK a similar shift took place.
The social and economic outcomes of this worsening inequality in the US have been highly problematic. There are again many working poor in America, a painful outcome in the wealthiest country the world has ever known. Guy Standing, a British economist, even coined the term precariat, to point to “an emerging class, comprising the rapidly growing number of people facing lives of insecurity, moving in and out of jobs that give little meaning to their lives.”70
Seen from this perspective, it is no wonder that in 2011, a one-page call for action in an activist magazine led to one of the most supported American protest movements of this century. The page in AdBusters read, “17 September. Wall Street. Bring Tent.” Protestors did in fact show up in lower Manhattan on that day, they brought tents, and with that, Occupy Wall Street was born. Referencing the extreme inequality in America, the movement's rallying cry became “We are the 99 percent,” and the protestors decried the wealth, income, and power accumulated by the 1 percent richest individuals and corporations in America. As you can see from Figure 2.4, this dichotomy between the 1 percent and the rest of income earners was not imaginary.
The same pattern exists in other parts of the world, and in some countries the outrage over these inequalities has erupted with equal force as it has in the English-speaking world. In fact, it was movements in the Mediterranean and Middle East that inspired Occupy Wall Street, Kalle Lasn, one of the founders of Occupy, told one of us in a 2012 interview.71 There, in the early years of this decade, Spanish Indignados took to the streets in protest. A year later, Arab Spring protesters in Tunisia, Egypt, Syria, and other countries took the streets to express their anger over economic inequities within their countries. In Tunisia, they forced a regime change.
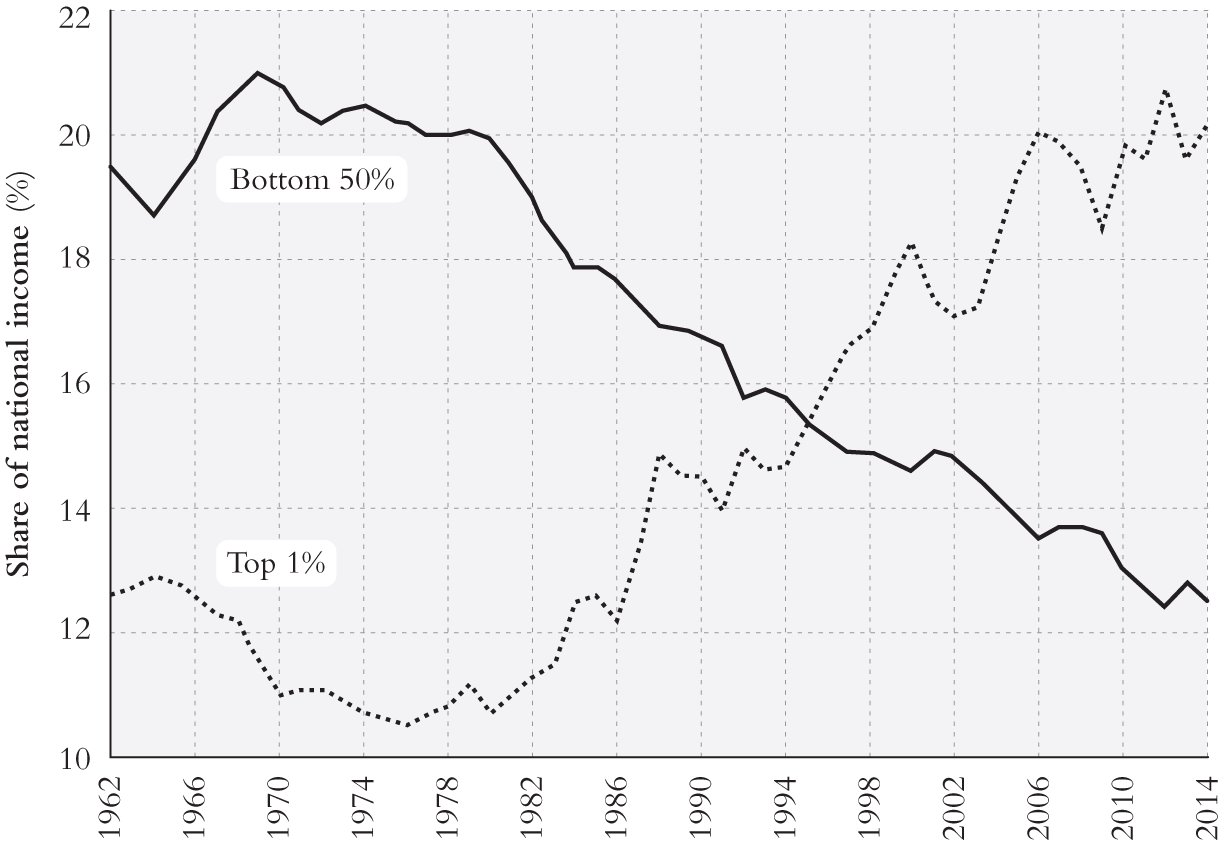
Figure 2.4 In the US, Income Inequality Has Risen Sharply
Source: Redrawn from Piketty, Saez and Zucman (2018), World Inequality Report 2018..
“We saw what happened in Tunisia, with the regime change, and started to brainstorm about what that would look like in America,” Lasn said. A “soft regime change” in the US, he said, would be to take away power and money from large corporations, which decided “every part of my life. We felt that we had reached a situation—with unemployment of young people, huge student debt, and no good jobs—where if we didn't fight for our future, we wouldn't have a future. That was the core impulse behind Occupy Wall Street.”
In other countries, particularly in emerging Asia, the social outrage over rising inequality has been less pronounced. In China, India, and many ASEAN nations, national inequality also rose. However, overall economic growth in that region was much higher, so a rising tide did in fact lift most boats. Still, the specter of class tensions looms over some of these countries as well (see Chapter 3).
As author James Crabtree highlighted in his book The Billionaire Raj, India is now one of the most unequal societies in the world, to the point of embodying a new Gilded Age society. Unlike in India, in China, most of the population started on the same footing when the country opened to the world. Despite this, China has seen its inequality surge, too, with the top 10 percent now capturing 41 percent of their nation's income.72 In many other emerging markets, the situation is even worse. Just as in the United States, the top 10 percent are taking home more than half their nation's income in countries across the Middle East, Sub-Saharan Africa, and many Latin American countries, including Brazil.
Inequality in continental Europe is slightly less pronounced, with 37 percent of income captured by the top 10 percent of earners. While inequality has been rising, it has done so at a considerably slower pace than in most other leading economies. This is partially due to Europe's greater system of check and balances to facilitate income distribution and redistribution.
But some uncomfortable realities remain here, too. In much of Southern and Eastern Europe, for example, unemployment remains stuck at high levels, especially for the young. Well-paid jobs there are increasingly hard to get, often to the detriment of both blue-collar workers and university-educated youth. Even Northern European economies, which kept a decent growth pace after the European debt crisis put a strain on Europe-wide growth as of 2010, saw their income inequality levels rise in the past decade. Counterexamples such as Belgium,73 Estonia, Romania, Slovakia, or the Czech Republic,74 which experienced declining inequality, remain the exception.